Graphing guide
How I Graph an Equation to Check a Solution
By Evan LiUpdated
I use a graph as a second opinion, not as proof. When an equation says left side = right side, I can graph the two sides as separate functions and look for the x-values where the curves meet. That visual check is especially useful when I want to catch a sign mistake or understand why an equation has zero, one, or two real solutions.
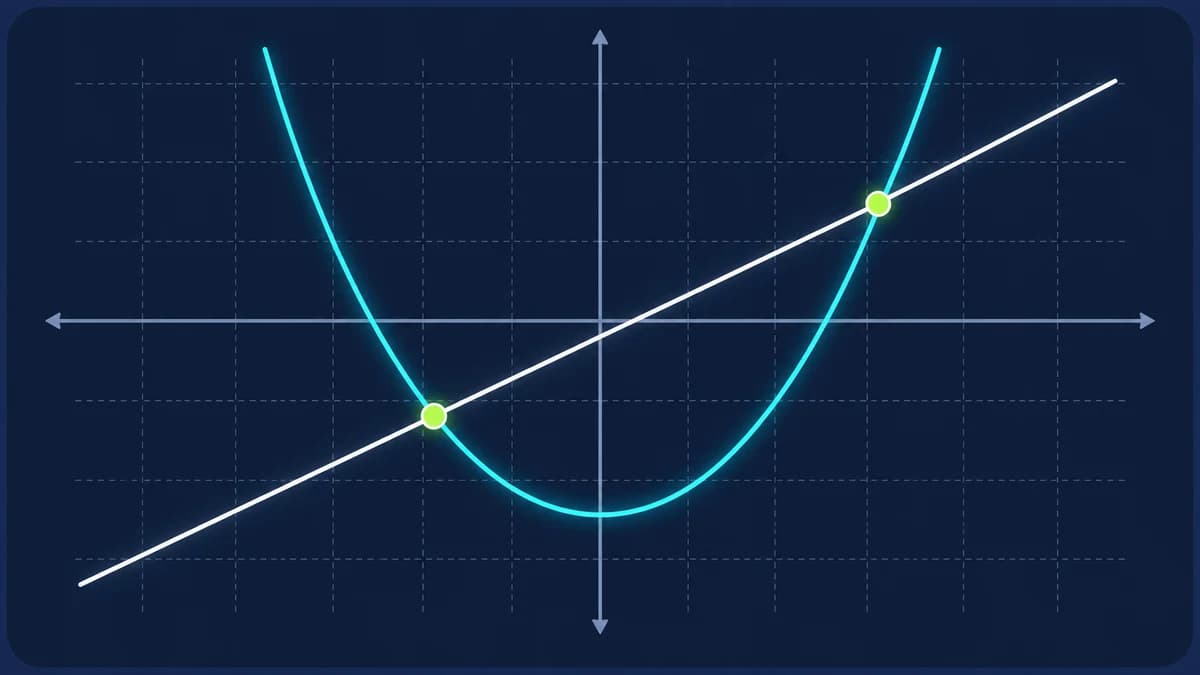
I turn the equation into two functions instead of moving everything first
For 2x + 5 = 15, I think of y = 2x + 5 and y = 15. The solution is the x-coordinate of their intersection. For x² - 5x + 6 = 0, I can graph y = x² - 5x + 6 and y = 0. The x-axis intersections occur at the same roots I get from factoring.
I like this approach because it preserves the original equation. If x appears on both sides, I do not have to simplify before I can visualize it; I can plot each side exactly as entered and compare where they match.
The graph window matters more than I expected
A correct graph can still look useless if the window is badly chosen. If the solution is near x = 50 but I only look from -10 to 10, the intersection never appears. If a rational function has a vertical asymptote, an excessively wide y-range can flatten everything else until the useful shape is nearly invisible.
That is why the graph in the calculator chooses an x-range around known finite solutions when it has them, then estimates a practical y-range from sampled values. It is not trying to be a full computer algebra graphing system; it is trying to make the solved equation easy to inspect.
I pay attention to discontinuities and asymptotes
Rational equations are where a simple polyline can mislead me. Near a denominator zero, the function can shoot from a large positive value to a large negative value. If I draw one continuous line across that jump, it looks like the curve passes through points it never reaches.
The graph therefore breaks a plotted segment when sampled values become non-finite or jump too far on screen. I still rely on the algebraic domain restriction to decide whether a candidate is valid. The visual break is a warning, not a replacement for checking the denominator.
A graph helps me understand multiplicity and no-real-solution cases
For a quadratic with two real roots, the parabola crosses the x-axis twice. With one repeated real root, it just touches the axis. With no real roots, it never meets the x-axis. Seeing those three shapes makes the discriminant much less abstract.
But I do not estimate an exact root from pixels if the algebra can give it exactly. The graph is useful for shape, sanity checking, and locating approximate intersections. The solver remains the source for exact fractions or radicals.
My final rule: if the graph and algebra disagree, investigate the disagreement
I never choose the graph just because it looks convincing. I check whether I entered the same equation, whether the plotting window hides an intersection, whether a denominator created a discontinuity, and whether a radical or absolute-value expression was interpreted correctly. A disagreement is useful because it points to something I need to inspect.
That is why the site places the graph after the algebraic answer, steps, and verification. It is designed to add context to a result that already has a mathematical path, not to produce a standalone visual guess.